3(iii)
Write a Python program using the Matplotlib library to display the number of robots used in different sectors as shown below:
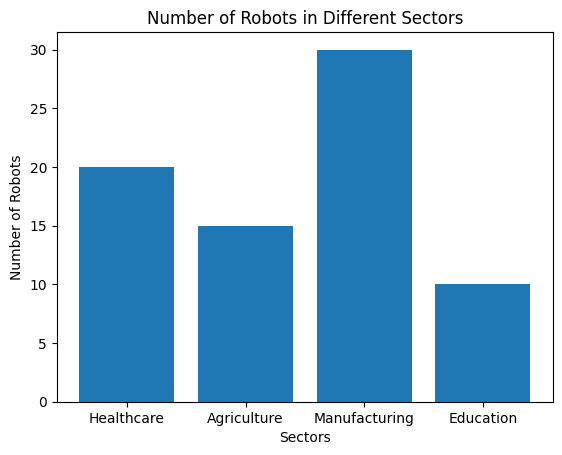
| Sector | Number of Robots |
|---|---|
| Healthcare | 20 |
| Agriculture | 15 |
| Manufacturing | 30 |
| Education | 10 |
The program should:
1. Import the required Matplotlib library.
2. Create suitable lists for sectors and the corresponding number of robots.
3. Plot a bar graph.
4. Label the X-axis as "Sectors".
5. Label the Y-axis as "Number of Robots".
6. Give the graph a suitable title.
7. Display the graph.
Show SolutionHide Solution↓
import matplotlib.pyplot as plt

sectors = ['Healthcare', 'Agriculture', 'Manufacturing', 'Education']
robots = [20, 15, 30, 10]

plt.bar(sectors, robots)
plt.xlabel("Sectors")
plt.ylabel("Number of Robots")
plt.title("Number of Robots in Different Sectors")
plt.show()
Output