3(iii)
Write a Python program to plot a line chart using Matplotlib library using the following data:
- (a)Import the necessary libraries.
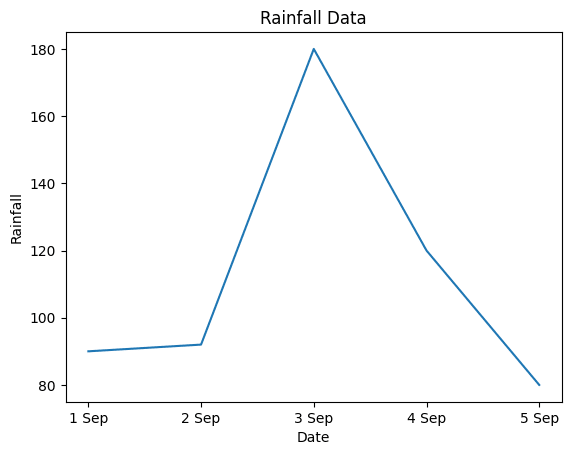
- (b)Store the dates from 1st September to 5th September (both inclusive) and their corresponding rainfall data as 90 mm, 92 mm, 180 mm, 120 mm, and 80 mm respectively.
- (c)Plot a line chart to visualise the rainfall.
- (d)Add appropriate labels for the X-axis (Date) and Y-axis (Rainfall).
- (e)Set a title for the chart as 'Rainfall Data'.
Show SolutionHide Solution↓
import matplotlib.pyplot as plt

date = ['1 Sep', '2 Sep', '3 Sep', '4 Sep', '5 Sep']
rainfall = [90, 92, 180, 120, 80]

plt.plot(date, rainfall)
plt.xlabel("Date")
plt.ylabel("Rainfall")
plt.title("Rainfall Data")
plt.show()
Output