1(xvii)
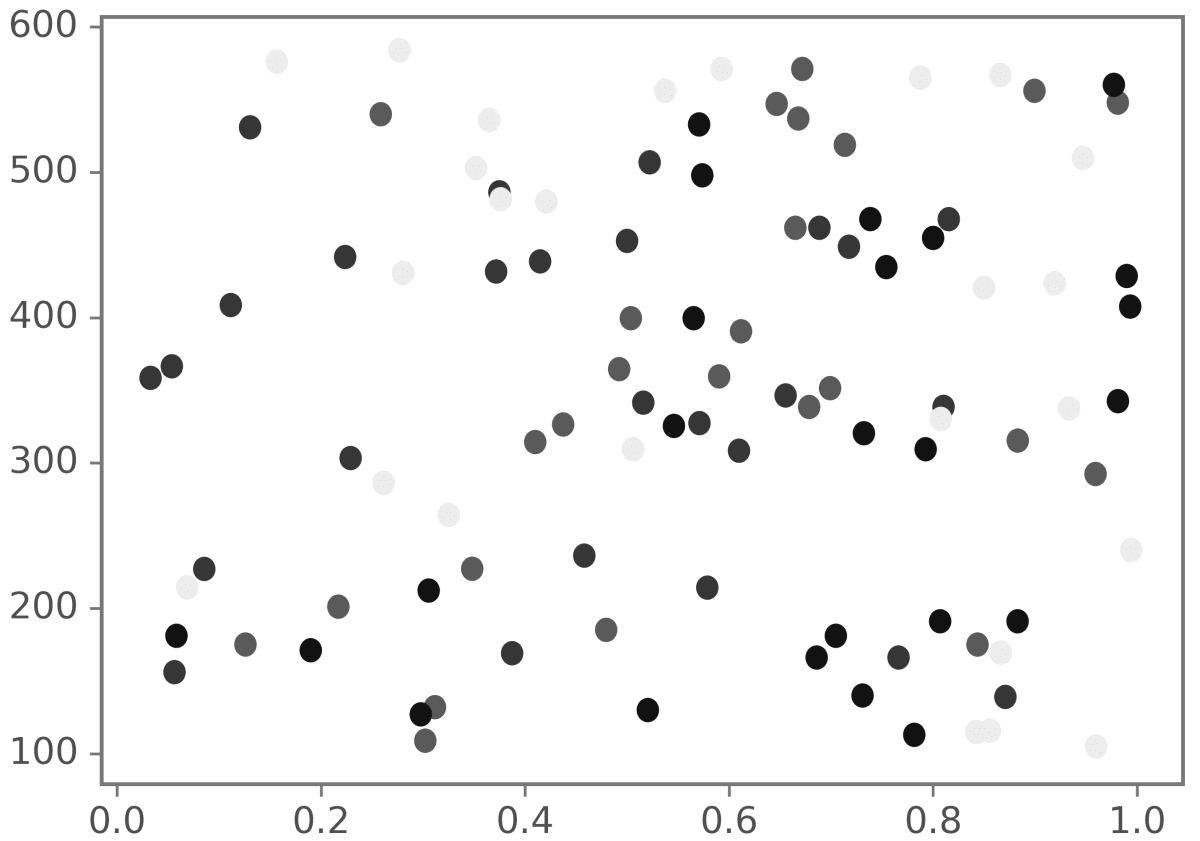
Identify the type of plot shown below.
- (a)Line plot
- (b)Bar plot
- (c)Pie plot
- (d)Scatter plot
Show SolutionHide Solution↓
Scatter plot
Reason — The figure shows data represented using scattered dots, where each dot represents a single data point. Such a plot is used to show the relationship between two sets of values and is known as a scatter plot.