9(ii)
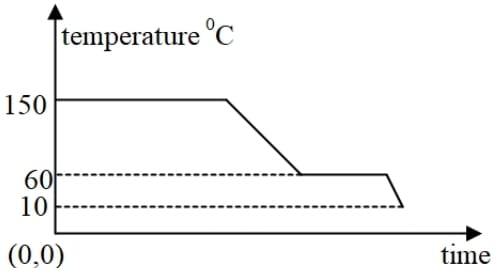
The diagram below shows a cooling curve for a substance:
(a) State the temperatures at which the substance condenses.
(b) The temperature range in which the substance is in liquid state.
(c) Why do we prefer ice to ice-cold water for cooling a drink?
Show SolutionHide Solution↓
(a) Substance condenses at 150° C
(b) 150 to 60°C
(c) 1 g of ice at 0° C takes 336 J of heat energy from the drink to melt into water at 0° C. Thus, the drink liberates an additional 336 J of heat energy to 1 g ice at 0° C than to 1 g ice-cold water at 0° C. Therefore, cooling produced by 1 g ice at 0° C is much more than that by 1 g water at 0° C.