The distribution given below represents marks obtained by 200 students in a Mathematics Examination with maximum marks 80.
| Marks | No. of students |
|---|---|
| 0 – 10 | 8 |
| 10 – 20 | 12 |
| 20 – 30 | 16 |
| 30 – 40 | 24 |
| 40 – 50 | 29 |
| 50 – 60 | 38 |
| 60 – 70 | 42 |
| 70 – 80 | 31 |
Using graph paper draw an ogive for the given distribution. Along one axis take 2 cm equal to 10 marks and along the other axis take 1 cm equal to 10 students.
Use your graph to find the following :
(a) Median
(b) Number of students who scored above 75 marks
(c) If the pass percentage is 35%, find the number of students who scored 35% and below.
Show SolutionHide Solution↓
| Marks | No. of students (f) | Cumulative frequency (cf) |
|---|---|---|
| 0 - 10 | 8 | 8 |
| 10 - 20 | 12 | 20 |
| 20 - 30 | 16 | 36 |
| 30 - 40 | 24 | 60 |
| 40 - 50 | 29 | 89 |
| 50 - 60 | 38 | 127 |
| 60 - 70 | 42 | 169 |
| 70 - 80 | 31 | 200 |
Steps :
Take 2 cm = 10 marks on the x-axis.
Take 1 cm = 10 students on the y-axis.
Plot the points (0, 0), (10, 8), (20, 20), (30, 36), (40, 60), (50, 89), (60, 127), (70, 169) and (80, 200).
Join the points by a free hand curve.
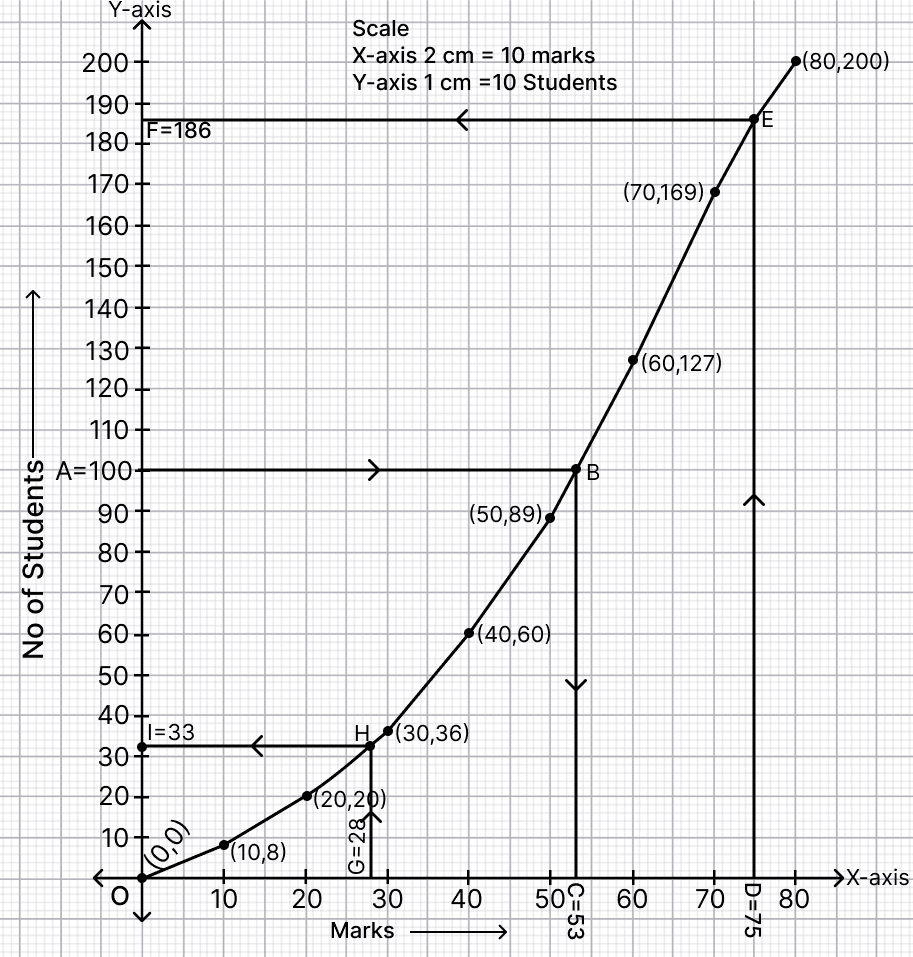
(a) Here, $n$ (no. of students) = 200, which is even.
Median = $\frac{n}{2} = \frac{200}{2}$ = 100th term.
Through point A = 100 on the y-axis draw a horizontal line parallel to the x-axis touching the graph at point B, through B draw a vertical line parallel to the y-axis touching the x-axis at point C = 53.
Hence, median = 53.
(b) Through point D = 75 on the x-axis draw a vertical line parallel to the y-axis touching the graph at point E, through E draw a horizontal line parallel to the x-axis touching the y-axis at point F = 186.
∴ 186 students scored 75 marks and below.
∴ Number of students who scored above 75 marks = 200 − 186 = 14.
Hence, 14 students scored above 75 marks.
(c) Maximum marks = 80
Pass marks = 35% of 80 = $\frac{35}{100} \times 80$ = 28 marks
Through point G = 28 on the x-axis draw a vertical line parallel to the y-axis touching the graph at point H, through H draw a horizontal line parallel to the x-axis touching the y-axis at point I = 33.
Hence, 33 students scored 35% and below.