Using a graph paper, draw an ogive for the following distribution which shows a record of weight in kilograms of 100 students.
| Weight (in kg) | Number of students |
|---|---|
| 35 – 40 | 4 |
| 40 – 45 | 6 |
| 45 – 50 | 10 |
| 50 – 55 | 24 |
| 55 – 60 | 26 |
| 60 – 65 | 17 |
| 65 – 70 | 8 |
| 70 – 75 | 5 |
Use your ogive to estimate the following:
(a) the median weight of the students.
(b) percentage of students whose weight is 60 kg or more.
(c) the weight above which 20% of the students lie.
Show SolutionHide Solution↓
The cumulative frequency table for the given continuous distribution is :
| Weight (in kg) | Number of students | Cumulative frequency |
|---|---|---|
| 35 – 40 | 4 | 4 |
| 40 – 45 | 6 | 10 |
| 45 – 50 | 10 | 20 |
| 50 – 55 | 24 | 44 |
| 55 – 60 | 26 | 70 |
| 60 – 65 | 17 | 87 |
| 65 – 70 | 8 | 95 |
| 70 – 75 | 5 | 100 |
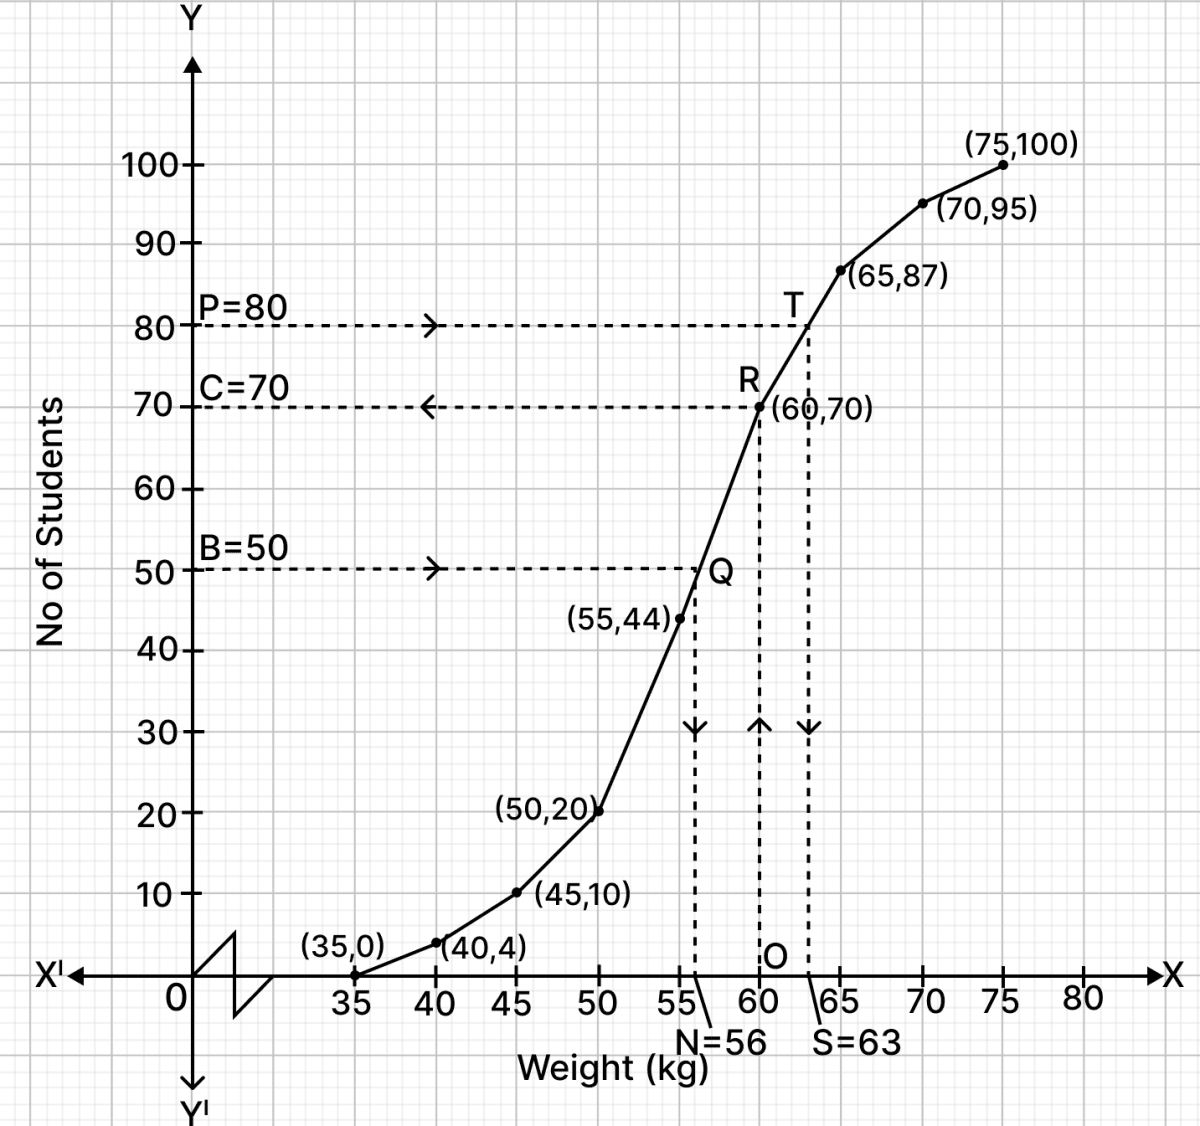
(a) Steps of Construction :
Since, the scale on x-axis starts at 35, a break (kink) is shown near the origin on x-axis to indicate that the graph is drawn to scale beginning at 35.
Take 1 cm along x-axis = 5 kg (weight)
Take 1 cm along y-axis = 10 (students)
Plot the points (40, 4), (45, 10), (50, 20), (55, 44), (60, 70), (65, 87), (70, 95), (75, 100) representing upper class limits and the respective cumulative frequencies. Also plot the point representing lower limit of the first class i.e. 35 - 40.
Join these points by a freehand drawing.
The required ogive is shown in figure above.
Here, n (no. of students) = 100.
To find the median :
Let B be the point on y-axis representing frequency = $\frac{n}{2} = \frac{100}{2} = 50$.
Through B draw a horizontal line to meet the ogive at Q. Through Q, draw a vertical line to meet the x-axis at N. The abscissa of the point N represents .
From graph, N = 56
Hence, the median weight = 56 kg.
(b) Percentage of students whose weight is 60 kg or more.
Let O be the point on x-axis representing weight = 60.
Through O draw a vertical line to meet the ogive at R. Through R, draw a horizontal line to meet the y-axis at C. The ordinate of the point C represents .
From graph,
C = 70
Students weighing more than 60 kg = 100 - 70 = 30.
Percentage of students weighing more than 60 kg = $\frac{30}{100} \times 100$ = 30%
Hence, students weighing more than 60 kg = 30%.
(c) The weight above which 20% of the students lie.
Total number of students = 100
20% of students = $\frac{20}{100}$ × 100 = 20.
So, 80 students are below that weight.
Let P be the point on y-axis representing number of students = 80.
Through P draw a horizontal line to meet the ogive at T. Through T, draw a vertical line to meet the x-axis at S. The ordinate of the point S represents weight above which 20% of the students lie.
From graph,
S = 63
Hence, weight above which 20% students lie = 63 kg.