Use graph paper for this question; draw the histogram and estimate mode for the following data. Use 2 cm = 10 units along the x-axis, and 2 cm = 2 units along the y-axis.
| Class | Frequency |
|---|---|
| 30 – 40 | 10 |
| 40 – 50 | 12 |
| 50 – 60 | 18 |
| 60 – 70 | 9 |
| 70 – 80 | 11 |
Show SolutionHide Solution↓
Steps of construction :
Take 2 cm = 10 units along the x-axis and 2 cm = 2 units along the y-axis.
Draw the rectangles (bars) for each class with heights equal to their frequencies.
The modal class is the class with the highest frequency, i.e. 50 – 60 (frequency 18).
In the highest rectangle, draw two lines AC and BD from corners of the rectangles on either side of the highest rectangle to the opposite corners of the highest rectangle. Let P be the point of intersection of AC and BD.
From the point of intersection of AC and BD, draw a vertical line to meet the x-axis. The point where it meets the x-axis gives the mode.
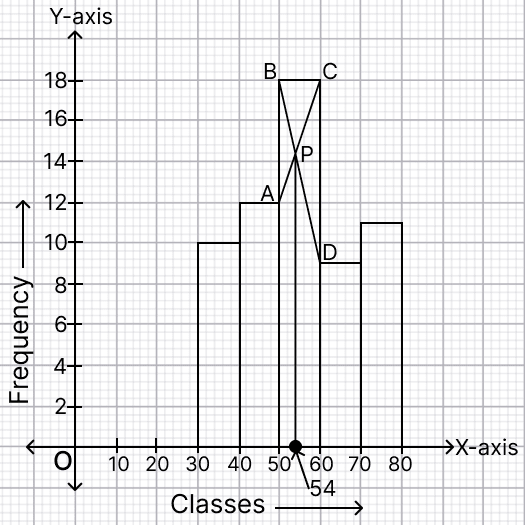
From the graph, the mode = 54.
Hence, the mode = 54.