Use a graph paper for this question:
The Marks out of 80 obtained by 160 students in a Mathematics test were recorded as given in the table:
| Marks | No. of students |
|---|---|
| 0 - 10 | 12 |
| 10 - 20 | 20 |
| 20 - 30 | 28 |
| 30 - 40 | 35 |
| 40 - 50 | 29 |
| 50 - 60 | 16 |
| 60 - 70 | 12 |
| 70 - 80 | 8 |
(Take 2 cm = 10 Marks on one axis and 2 cm = 20 students on the other axis).
Draw an Ogive and use it to find the following:
(a) median marks
(b) upper quartile marks
(c) number of students who scored above 65 marks
(d) the lowest marks scored by the top 30% students.
Show SolutionHide Solution↓
Steps of Construction:
- The cumulative frequency table for the given continuous distribution is :
| Marks | No. of students | Cumulative frequency |
|---|---|---|
| 0 - 10 | 12 | 12 |
| 10 - 20 | 20 | 32 |
| 20 - 30 | 28 | 60 |
| 30 - 40 | 35 | 95 |
| 40 - 50 | 29 | 124 |
| 50 - 60 | 16 | 140 |
| 60 - 70 | 12 | 152 |
| 70 - 80 | 8 | 160 |
Take 2 cm along x-axis = 10 (marks)
Take 2 cm along y-axis = 20 (students)
Plot the points (10, 12), (20, 32), (30, 60), (40, 95), (50, 124), (60, 140), (70, 152), (80, 160) representing upper class limits and the respective cumulative frequencies. Also plot the point representing lower limit of the first class i.e. 0 - 10.
Join these points by a freehand drawing.
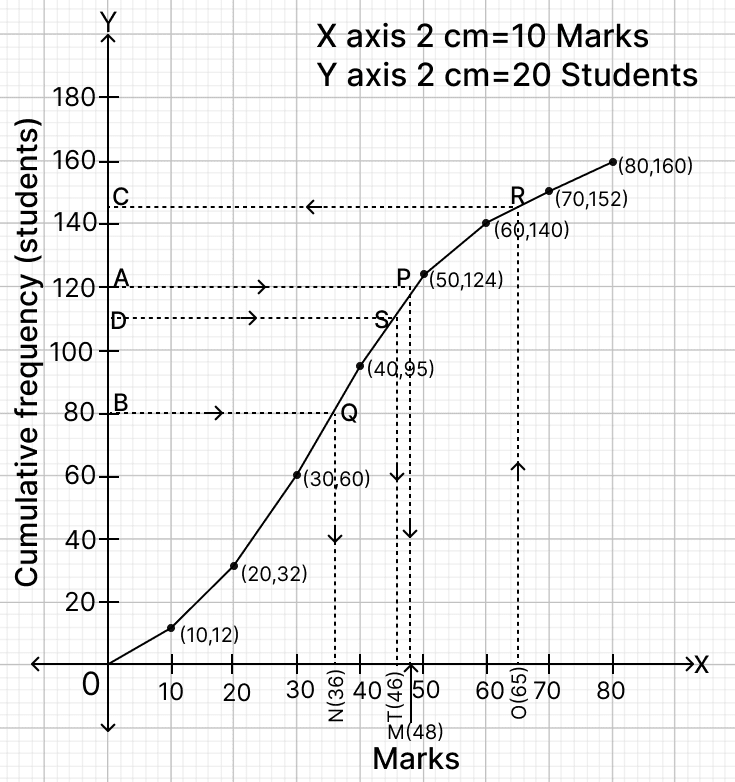
The required ogive is shown in figure above.
(a) Here, n (no. of students) = 160.
To find the median :
Let B be the point on y-axis representing frequency = $\frac{n}{2} = \frac{160}{2} = 80$.
Through B draw a horizontal line to meet the ogive at Q. Through Q, draw a vertical line to meet the x-axis at N. The abscissa of the point N represents 36.
Hence, the median marks = 36.
(b) To find upper quartile :
Let A be the point on y-axis representing frequency
$\frac{3n}{4} = \frac{3 \times 160}{4} = 3 \times 40 = 120$.
Through A, draw a horizontal line to meet the ogive at P. Through P, draw a vertical line to meet the x-axis at M. The abscissa of the point M represents 48.
Hence, upper quartile = 48.
(c) Above marks = 65 marks.
Let O be the point on x-axis representing marks = 65.
Through O draw a vertical line to meet the ogive at R. Through R, draw a horizontal line to meet the y-axis at C. The ordinate of the point C represents 146.
Hence, 146 students score less than or equal to 65 so students scoring more than 65 = 160 - 146 = 14.
Hence, 14 students score more than 65 marks.
(d) The top 30% of students represent 30% of the total number of students.
Total number of students = 160
Number of students in top 30% = $\frac{30}{100}$ × 160 = 48.
The students who scored the lowest marks in the top 30% = 160 - 48 = 112 position in the cumulative frequency.
Through D = 112, draw a horizontal line to meet the ogive at S. Through S, draw a vertical line to meet the x-axis at T. The value on the x-axis is 46.
Hence, the lowest marks scored by the top 30% students are 46.