6(ii)
The table given below shows the ages of members of a society.
| Age (in years) | Number of members of society |
|---|---|
| 25-35 | 05 |
| 35-45 | 32 |
| 45-55 | 69 |
| 55-65 | 80 |
| 65-75 | 61 |
| 75-85 | 13 |
(a) Draw a histogram representing the above distribution.
(b) Estimate the modal age of the members.
Show SolutionHide Solution↓
Steps of construction :
Draw a histogram of the given distribution.
Inside the highest rectangle, which represents the maximum frequency (or modal class), draw two lines AC and BD diagonally from the upper corners C and D of adjacent rectangles.
Through the point K (the point of intersection of diagonals AC and BD), draw KL perpendicular to the horizontal axis.
The value of point L on the horizontal axis represents the value of mode.
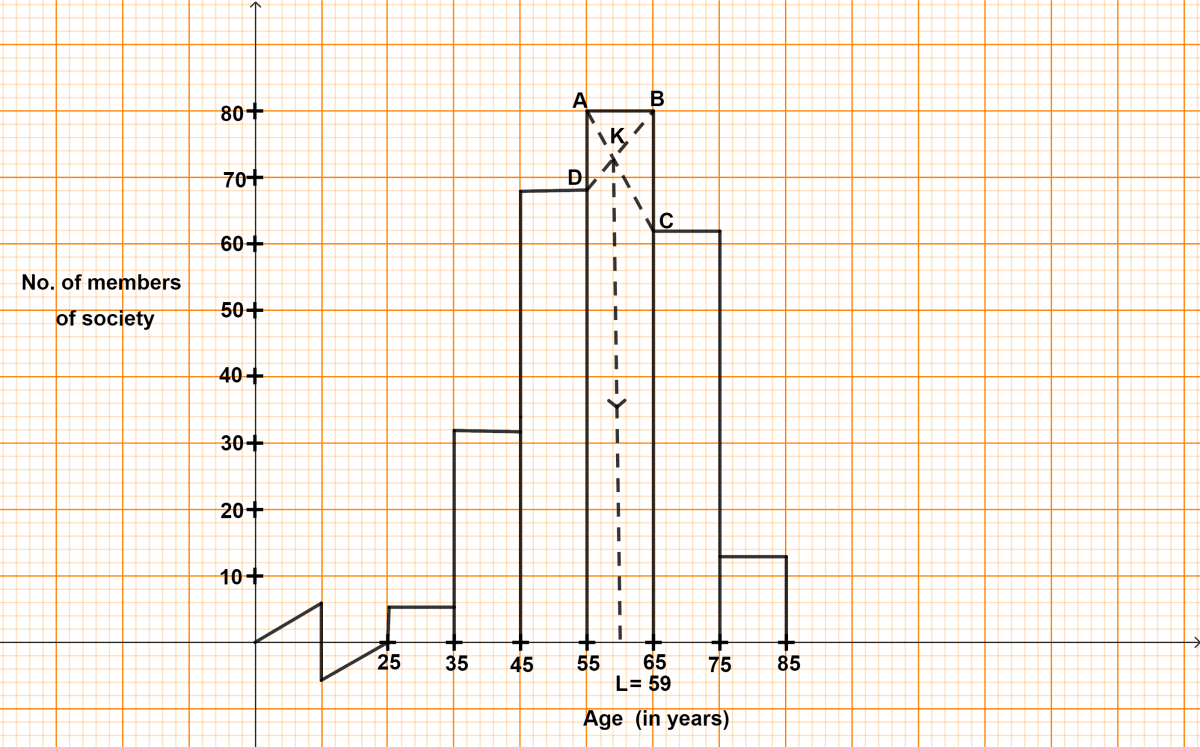
From graph,
L = 59 years
Hence, required mode = 59 years.