3(iii)
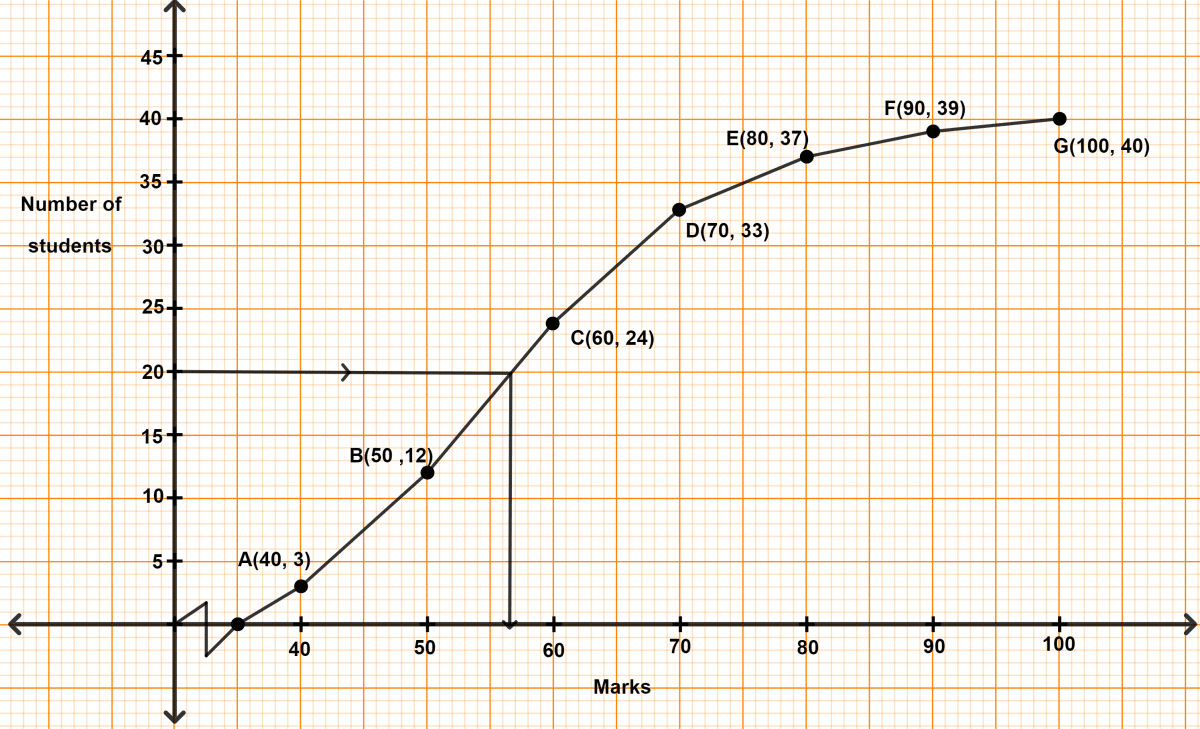
Study the graph and answer each of the following :
(a) Name the curve plotted
(b) Total number of students
(c) The median marks
(d) Number of students scoring between 50 and 80 marks.
Show SolutionHide Solution↓
(a) From graph,
The curve plotted is a cumulative frequency curve (ogive).
(b) From graph,
The total number of students = 40.
(c) From graph,
The median marks = 56.
(d) From graph,
No of students scoring below 80 = 37
No of students scoring below 50 = 12
∴ No. of students scoring between 50 and 80 = 37 - 12 = 25.
Hence, the no. of students scoring between 50 and 80 = 25.